See Your Factory Live
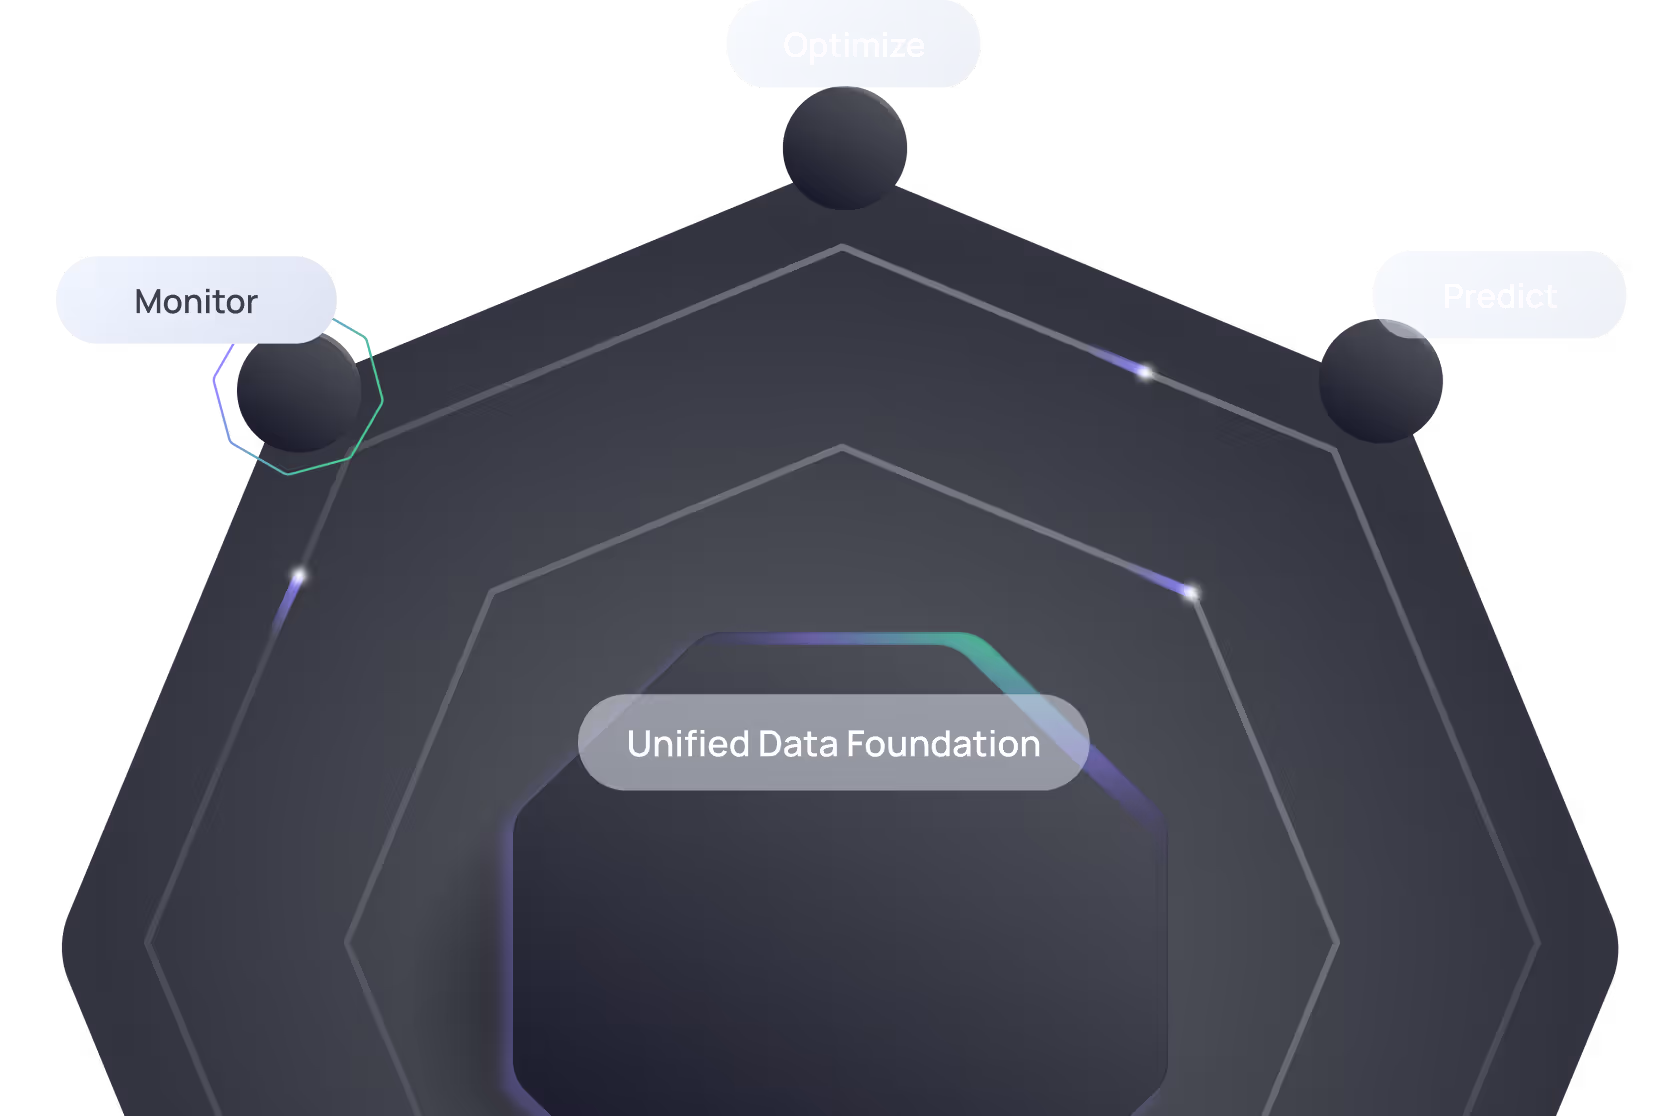
OctoCore turns fragmented shop-floor data into one real-time cockpit. From machine health to process trends and live video, every datapoint is streamed, structured, and synchronized in your Unified Namespace. Gain instant operational insight and scale visibility across lines and sites — all from one foundation.
Why Most Platforms Fail to Deliver Scalable Visibility
Manufacturing data lives across machines, systems, and spreadsheets, disconnected and inconsistent. Dashboards break, context is lost, and every site rebuilds the same views from scratch. The result is fragile visibility that cannot scale or sustain.

Solution in Three Steps


OctoCore Operational Visibility Use Cases
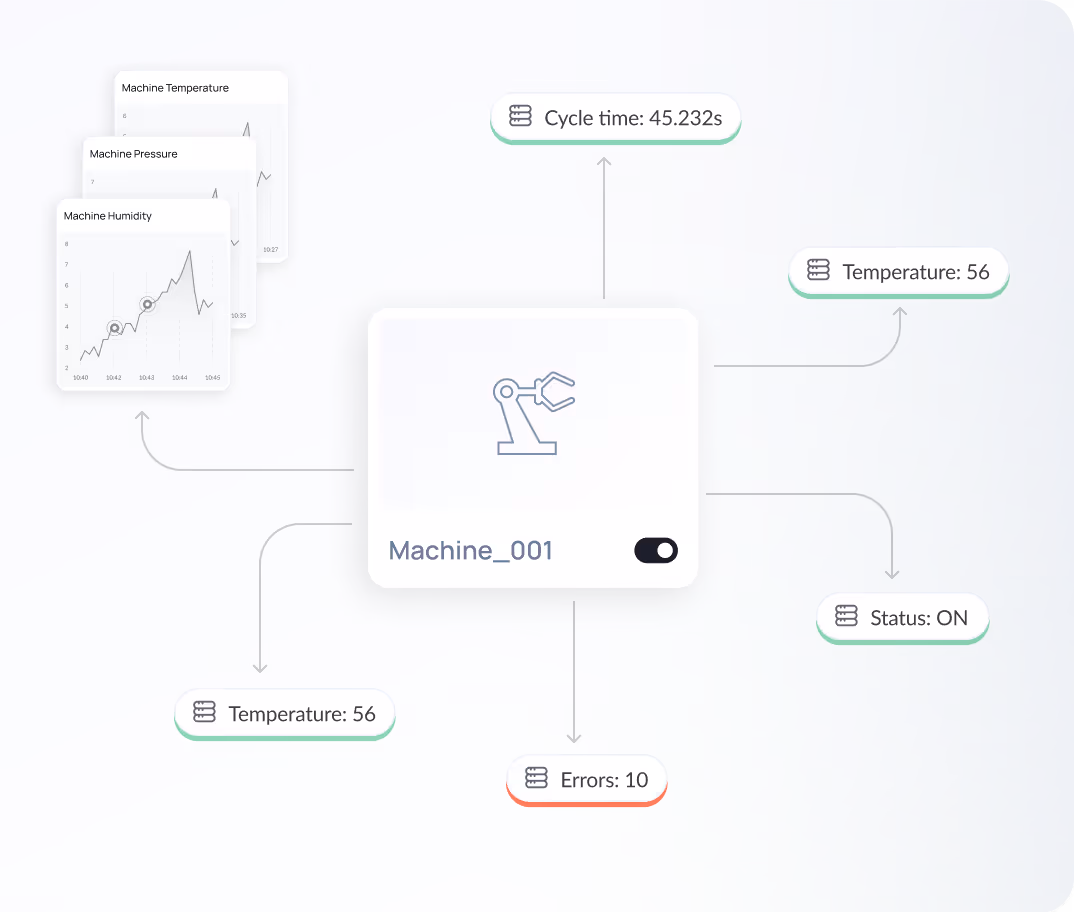
Machine Health Monitoring
OctoCore brings all critical machine data together in real time. Your team gets a clear, customizable view of temperature, vibration, pressure, cycle time, machine state, and more, all linked to article numbers and error logs. Everything is synchronized across OT and IT, displayed in visual dashboards, and can include video for instant validation. No code, full transparency.
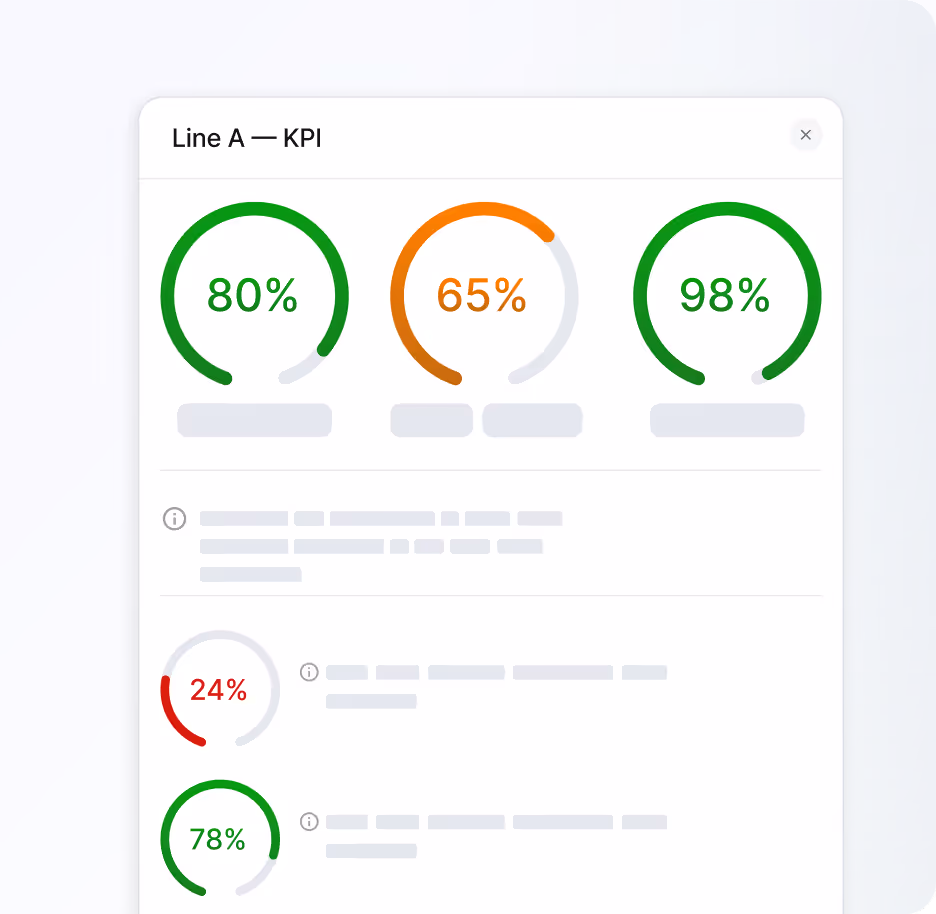
KPI Monitoring
Track output, scrap, energy, availability, and other key metrics live and in one place. Whether you use standard KPIs or build your own, every metric runs on the same structured data model, ensuring consistency across shifts, lines, and plants. One version of truth for your entire team.
AI-Generated Operational Reports
Turn complex factory data into actionable insights in seconds. OctoCore’s AI Chat instantly generates reports from your live data, answering questions like “Where did we lose the most time today” or “Show me scrap trends from last week.” Get clear, context-rich answers without switching tools or copying data.
Further Use Cases
Cross-Plant & Line Comparison
Compare KPIs such as OEE, scrap, cycle time, or energy usage across lines and plants using one shared data model. Identify top-performing sites, detect deviations instantly, and align global operations with one consistent view.
Energy Monitoring
Track and analyze energy consumption in real time by machine, product, or batch. Correlate energy patterns with downtime, process shifts, or product changes to reveal hidden savings and efficiency opportunities.
Traceability
Follow every order or batch through the full production process in real time. Combine machine data, order information, and video in one searchable timeline to quickly pinpoint deviations or quality issues.
Real-Time Alerts and Notifications
Create alerts based on thresholds or logic for any machine or process. Automatically notify the right team through email, SMS, or connected systems the moment action is needed.
Who This Is For
Operational visibility that gives every stakeholder the insight they need, exactly when they need it.
Team Leads and Supervisors
Monitor live production KPIs, receive alerts early, and recognize performance patterns before issues escalate.

Plant Managers
Compare performance across lines, shifts, and plants to identify bottlenecks and losses. Make decisions based on one standardized data source everyone can trust.

OT and Automation Engineers
Access clean, structured process data from sensors to PLC signals in one unified system. Eliminate ad hoc scripts and focus on continuous improvement.

Ready to Unlock Your Use Case Galaxy?
See OctoCore in action, explore your own data live, and discover how quickly you can move from data to solutions.